
Part 1 was about what to push. This one is about making it boring: scheduled, self-monitoring, alertable, and testable without a live model. In monitoring, boring is the highest compliment going.
Execution pipeline
Each run does seven things:
- Authenticate once to VCF Operations. PowerCLI’s Ops module gets the
token; native
Invoke-RestMethoddoes the rest, far faster. - Iterate targets from the config file.
- Resolve the resource: look up the Ops object by name. The target must already exist in Ops (a VM, a container object, a custom application). Exact match first, then a partial match with a warning.
- Scrape the Prometheus text from
:8000/metrics. - Parse and transform: gauges, counters, histograms; percentiles, deltas, derived scores; drop-list applied.
- Push in batches of 1000 stats per request. Ops rejects oversized payloads. A busy model produces ~150 stats per run, which fits easily; a config with ten targets doesn’t.
- Persist state: counters and timestamps for each target. Targets removed from the config are pruned from the state file automatically.
The stdout contract
The single most useful design choice is this. When run non-interactively, the script prints exactly one integer: the total number of stats pushed. It’s not a chatty script, but it is honest. Mostly; more on that below.
That makes it a Telegraf inputs.exec plugin with zero glue:
[[inputs.exec]]
  commands = ['powershell.exe -NoProfile -File C:\monitoring\Push-LLMMetrics.ps1']
  timeout = "50s"
  interval = "60s"
  data_format = "value"
  data_type = "integer"
  name_override = "llm_metrics_pushed"
Telegraf now has a series called llm_metrics_pushed that should read
~150 every minute. If it reads 0, the scrape failed. If it’s missing, the
script didn’t run. The integration monitors itself by construction, and
the thing watching it is the same Telegraf you already run.
(Task Scheduler or cron work too, running
powershell.exe -File Push-LLMMetrics.ps1 every 60 s. You just lose the
free self-monitoring.)
Configuration
Credentials and targets live in a JSON file beside the script, never in it:
{
  "vrops": {
    "server": "vcfops.example.lab",
    "user": "svc_vllm_metrics",
    "password": "<from-credential-store>",
    "auth_source": "local"
  },
  "targets": [
    { "subject": "LLM01", "metrics_url": "http://10.0.0.5:8000/metrics" },
    { "subject": "LLM02", "metrics_url": "http://10.0.0.6:8000/metrics" }
  ]
}
subject must match the Ops resource name exactly. -ConfigPath overrides
the location for scheduled tasks. auth_source is local or your Active
Directory domain.
Logging that doesn’t fill the disk
Interactive runs get colour-coded console output. Silent runs copy
everything to llm-metrics.log, which rotates itself to .old at 5 MB. A
log that fills the disk would turn the monitoring into the incident. The
three warnings you’ll actually see:
| Log line | Meaning | Action |
|---|---|---|
Resource NOT found with exact name 'LLM01' - looking for partial match | Ops object name doesn’t match subject | create the object or fix the spelling |
Rates are exactly 0 | no traffic since last run | normal when idle |
Time gap too large (>300s). Resetting baseline | scheduler paused / host rebooted | normal; rates resume next run |
And one error: API Error on batch: 401 Unauthorized. The service account
has expired or been locked. It’s the only failure that needs a human.
The offline test mode
You do not need a GPU to build this. metrics_url accepts file://:
{ "subject": "LLM01", "metrics_url": "file://C:/temp/llm_metrics.txt" }
Save one real /metrics scrape to a text file and point the config at it.
Then iterate on parsing and Ops resource mapping at your desk.
To test the rate maths, bump the counter values in the file between runs.
The script can’t tell the difference, and neither can Ops.
The four alerts to configure on day one
Everything in part 1 was designed so these four symptoms are one metric each:
| Alert | Symptom | What it means |
|---|---|---|
| vLLM Engine Down | vllm|system|is_up missing or < 1 | container crashed or /metrics unreachable |
| OOM Imminent | vllm|perf|system_saturation_score > 90 | KV cache full, queue stacking — new prompts will be rejected |
| Severe End-User Lag | vllm|perf|live_avg_tpot_ms > 100 | generating slower than people read (~50 ms/token); users see stutter |
| Queue Spillage | vllm|queue|requests_swapped > 0 | engine evicting live requests to CPU RAM — should always be 0 |
Suggested thresholds for the rest, from the field:
live_avg_ttft_ms: warn 1000, critical 3000 (a slow first token drives users to give up)queue|pressure_ratio: warn 0.5, critical 1.0 (more waiting than running means scale out)memory|kv_cache_pct: warn 85, critical 95queue|preemptions_per_sec: warn above 0http|requests_per_secwell abovethroughput|requests_per_sec: users are getting 429/503 at the front door
What running it against a fresh Ops taught me
I re-ran the collector in file:// mode against a lab VCF Operations 9.1
that had never seen it, pointing at an existing VM object. Three findings
in the first ten minutes, which is either very efficient or slightly
worrying. All three are worth knowing before you deploy:
- The stdout integer lied once. The first two runs logged
[ERR] The SSL connection could not be establishedon the push, and still printedTotal stats pushed: 76. The counter tallies stats prepared, not batches accepted. Telegraf would have seen a healthy 76 while nothing landed. The fix for v6.4: increment only on a 2xx from the batch push, and print 0 on any batch error. Until then, alert on the log’s[ERR]lines too. - The push path needs its own certificate handling. The PowerCLI
connect honours
Set-PowerCLIConfiguration -InvalidCertificateAction Ignore; the nativeInvoke-RestMethodpushes don’t. On PowerShell 7, set$PSDefaultParameterValues['Invoke-RestMethod:SkipCertificateCheck']=$truebefore the run, or trust the Ops CA properly. Otherwise auth succeeds and every push fails. - Metric names drift between vLLM versions. Newer vLLM exposes
vllm:time_per_output_token_seconds, but the key builder was written forvllm:request_time_per_output_token_seconds. So the newer name fell through the hierarchy and landed as a raw top-level metric in Ops (vllm_time_per_output_token_seconds) instead ofvllm|perf|tpot|*. Everything else arrived exactly where the design says:vllm|perf|ttft|p95_ms,vllm|throughput|total_tokens_per_sec,vllm|perf|system_saturation_scoreand thehttp|request_durationpercentiles. Add the new name to the mapping, and treat “unexpected top-level metric” as a check in the smoke test.
Everything else worked first time: the resource resolved by name, 89 stats per run, batches accepted, and rates flowing from the second run onwards.
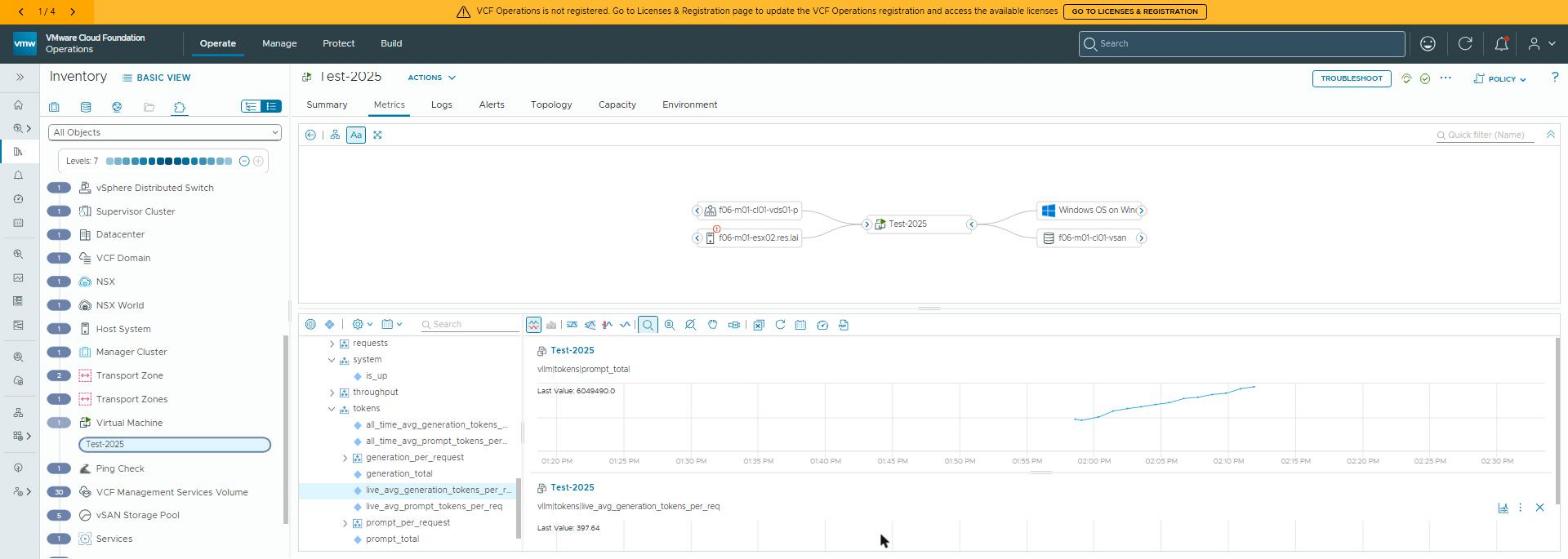 The tree as an operator sees it, browsable without a manual. Captured from the
 file:// test run above. The pipeline and the Ops side are real; the model behind the numbers was a saved scrape with advancing counters.
What I’d change
Two things, honestly:
- It’s PowerShell because the monitoring host was Windows and PowerCLI was already there. The same design ports to Python in an afternoon. The value is in the transformation, not the language.
- Resolving the Ops resource by name is fragile. Resolving it by an identifier, stored in the config after the first lookup, would survive a rename.
Why this matters outside the lab
The operational payoff is an AI service that can be run, not just hosted. You get four alerts that fire before users complain, and a saturation dial that tells capacity planners when to add a GPU. You also get an integration that reports its own health, so silence is never mistaken for calm.
For a customer, that’s the difference between an LLM pilot and an LLM in production. And the design ports to any workload that speaks Prometheus but has no VCF Operations adapter of its own.
Rules learned
- Make the collector’s stdout a single integer and let the scheduler (Telegraf) monitor the integration for free.
- Batch pushes (1000 stats). Authenticate once per run, not per push.
file://targets let you develop the whole pipeline with zero GPUs.- Four alerts cover 90 % of incidents: down, saturated, laggy, swapping. Everything else is a threshold on an existing gauge.
- Log rotation is part of the script, not an ops afterthought.
Broadcom documentation
- Custom Script: the Telegraf agent’s own exec-based script check, which also expects a single integer
- Acquire an Authentication Token:
POST /suite-api/api/auth/token/acquire, theauthSourcefield, and a token reusable for six hours - Alert Definitions in VCF Operations: alerts built from symptoms and recommendations
- Symptom Definitions in VCF Operations: metric symptoms at Warning and Critical levels, for the thresholds
Previously: don’t ship the histogram. Related: Telegraf on Windows Server 2025 — where this script actually runs.
Lab environment; opinions my own. Config sanitised.